Palmetto Bay Real Estate Report October 2022
Palmetto Bay Real Estate Report 2022.
When I decided to prepared this report I considered only Single Family Homes in Palmetto Bay. There not involved commercial properties, condos or empty lots. Looking at this report you can see that I have started in January 1st 2021 until October 18th 2022.
Hi, my name is Rafael Jarauta and I am a Real Estate Broker working in the Miami arena. In different medias some brokers or realtors are talking about the Miami market saying that the prices came down dramatically more than 30% but they are not showing the facts or the sources for that kind o information.
The reality is that since the interest rates came up dramatically, the amount of transactions went down as you can see in my report. The sold prices are just below the Listed Prices in the last 4 months from a 2 to 5%. Not a 30%.
I prefer to see the numbers from the source that is the Miami Association of Realtors where with a simple calculation we can see the truth.
Before that it is very important to see what were interest rates like in the 1980s.
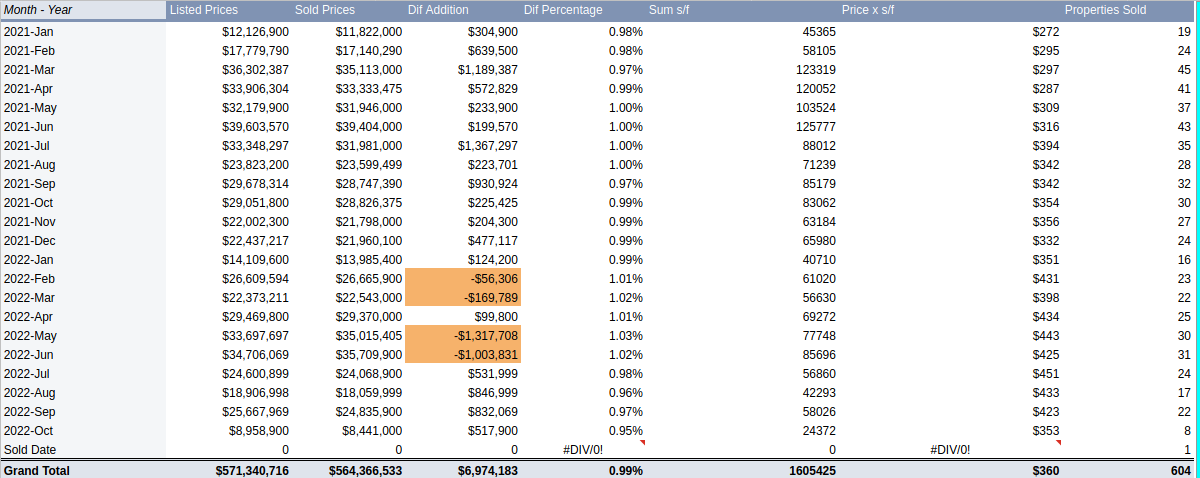
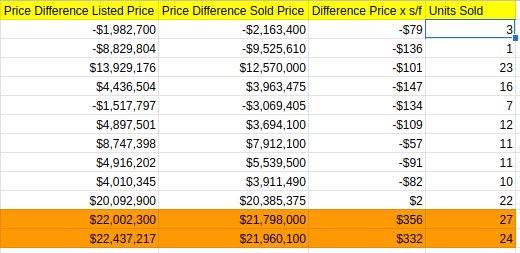
Lets move to the spreadsheet and see what is happening with the property prices:
The most important columns here are Listed Prices, Sold Prices, Percentage Difference, Price per s/f and Properties Sold.
Also on the bottom line, you will find the totals of each column and as you can see the analysis we are making here today involves 604 properties.
Looking at the Listed Prices versus Sold Prices we can see that during February, March, May and June of 2022 buyers paid above the listed prices, just before the interest rates started coming up.
If we move to the graphic area, we can have a better view about this behavior during those 4 months.

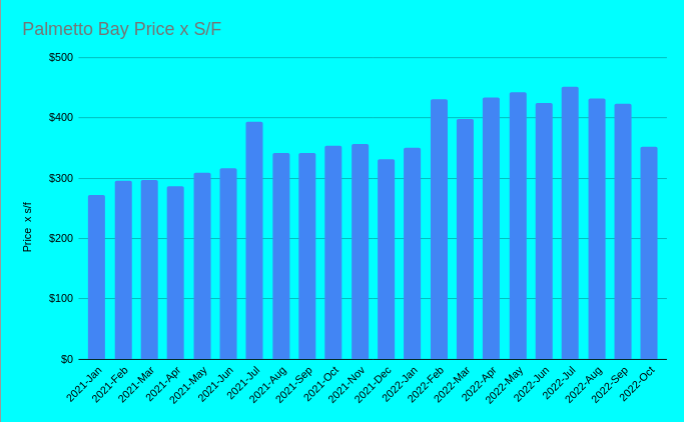
Now talking about the Price per s/f, we can see that in the month of July 2022 we have the maximum price per s/f paid for area in Palmetto Bay. For a better view we can see the graph here.
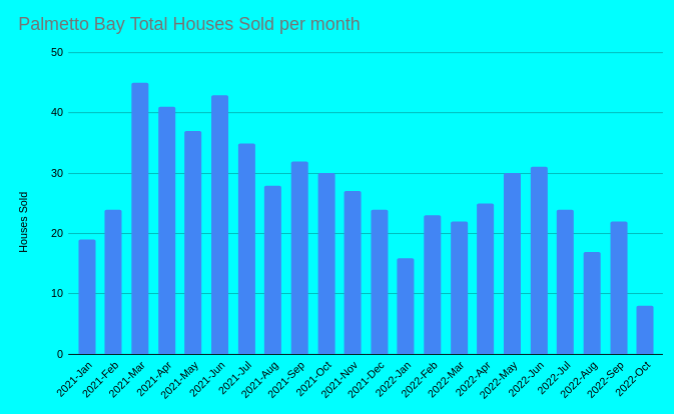
Moving to Total of Houses Sold we have a peak in March of 2021 with 45 properties sold and in 2022 we have the maximum amount of properties sold during the month of June. To a better view we can see in the graph March 2021 and June 2022 like the peaks.
As a final result we can see the differences per year with the price per s/f. The report is showing that during 2022 the prices per s/f came up in all months except October and for the months of November and December that we are not there yet.
Hopefully this report is giving you a better idea about what the Real Estate Market is doing in Palmetto Bay.
If you are considering that this message is not for you, please share it perhaps would be very beneficial to a friend, family member or a neighbor.
Thank you in advance.
#palmettobay #palmettobayrealestate #palmettobayrealestatemarket #homeforsale #houseforsale #palmettobayrealtor #palmettobayrealestatebroker